고정 헤더 영역
상세 컨텐츠
본문
0. 실습 환경 구성하기

- myeks-vpc에 3곳의 AZ를 사용하는 Public / Private Subnet을 구성합니다. 로드밸런서 배포를 위한 Public / Private Subnet에 Tag를 설정하였습니다.
- Operator-VPC에 AZ1을 사용하는 Public / Priavate subnet을 구성합니다.
- VPC 간 내부 통신을 위한 VPC Peering을 구성합니다.
[ Cloudformation을 이용한 실습환경 배포]
# 변수 지정
CLUSTER_NAME=myeks
SSHKEYNAME=<SSH 키 페이 이름>
MYACCESSKEY=<IAM Uesr 액세스 키>
MYSECRETKEY=<IAM Uesr 시크릿 키>
WorkerNodeInstanceType=<워커 노드 인스턴스 타입> # 워커노드 인스턴스 타입 변경 가능

# CloudFormation 스택 배포
aws cloudformation deploy --template-file myeks-4week.yaml --stack-name $CLUSTER_NAME --parameter-overrides KeyName=$SSHKEYNAME SgIngressSshCidr=$(curl -s ipinfo.io/ip)/32  MyIamUserAccessKeyID=$MYACCESSKEY MyIamUserSecretAccessKey=$MYSECRETKEY ClusterBaseName=$CLUSTER_NAME WorkerNodeInstanceType=$WorkerNodeInstanceType --region ap-northeast-2

# CloudFormation 스택 배포 완료 후 작업용 EC2 IP 출력
aws cloudformation describe-stacks --stack-name myeks --query 'Stacks[*].Outputs[0].OutputValue' --output text
# 관측 가능성 (Observability, o11y)
시스템의 내부 상태를 외부에서 측정 가능한 데이터(메트릭, 로그, 트레이스)를 통해 유추한다. 사전에 정의되지 않은 장애나 예측하기 어려운 문제까지 분석할 수 있도록 함.
* 3가지 주요 신호(Signal)
- 로그(Logs): 시스템 이벤트 및 오류 메시지 기록.
- 메트릭(Metrics): 시간 기반 성능 및 리소스 사용량 데이터.
- 트레이스(Traces): 분산 시스템에서 요청이 어떻게 흐르는지 추적.
* 예시
- 특정 사용자 요청이 느린 경우, 트레이스를 통해 어디서 병목이 발생했는지 분석.
- 예상치 못한 장애가 발생했을 때, 로그와 메트릭을 결합하여 원인을 파악.
* 모니터링(monitoring)과의 차이점
- 목적
- 모니터링: 시스템의 건강 상태를 확인하고, 문제가 발생했는지 감지. 예: 서버 다운 감지.
- 관측 가능성: 문제의 원인을 진단하고, 시스템 동작을 이해. 예: 왜 서버가 다운되었는지 분석.
- 데이터 수집
- 모니터링: 미리 정의된 메트릭(CPU 사용량, 메모리 사용량 등)에 초점. Monitoring - Oxford Reference에서는 모니터링을 "특정 프로세스의 성능 분석"으로 정의.
- 관측 가능성: 로그, 메트릭, 트레이스 등 다양한 데이터 소스를 통합적으로 사용. What is observability? Not just logs, metrics, and traces에서는 이를 "관측 가능성의 세 가지 기둥"으로 설명.
- 시스템 복잡성
- 모니터링: 단순한 시스템에 적합, 예: 단일 서버 환경.
- 관측 가능성: 복잡한 분산 시스템에 필수, 예: 마이크로서비스 아키텍처. Observability vs. Monitoring: Understanding the Differences | InfluxData에서는 분산 시스템에서 관측 가능성의 중요성을 강조.
- 사용자 상호작용
- 모니터링: 경고 기반, 예: 임계값 초과 시 알림.
- 관측 가능성: 동적 쿼리 및 분석 가능, 예: 특정 로그를 검색해 문제 원인 찾기.
모니터링은 "무엇이 잘못되었는지"를 감지하고 관측 가능성은 "왜 잘못되었는지"를 파악한다.
1. EKS Console
쿠버네티스 API를 통해 리소스 및 정보를 확인할 수 있다.

* Console 각 메뉴
1. Workloads : Pods, ReplicaSets, Deployments, and DaemonSets
- **Pods** : 네임스페이스 필터, **구조화된 보기** structured view vs **원시 보기** raw view
2. Cluster : Nodes, Namespaces and API Services
- **Nodes** : 노드 상태 및 정보, Taints, Conditions, **Labels**, Annotations 등
3. Service and Networking : Pods as Service, Endpoints and Ingresses
- **Service** : 서비스 정보, **로드 밸런서**(CLB/NLB) URL 정보 등
4. Config and Secrets : ConfigMap and Secrets
- ConfigMap & **Secrets** : 정보 확인, **디코드** Decode 지원
5. Storage : PVC, PV, Storage Classes, Volume Attachments, CSI Drivers, CSI Nodes
- **PVC** : 볼륨 정보, 주석, 이벤트
- Volume Attachments : PVC가 연결된 CSI Node 정보
6. Authentication : Service Account
- **Service Account** : IAM 역할 arn , add-on 연동
7. Authorization : Cluster Roles, Roles, ClusterRoleBindings and RoleBindings
- Cluster Roles & Roles : **Roles 에 규칙** 확인
8. Policy : Limit Ranges, Resource Quotas, Network Policies, Pod Disruption Budgets, Pod Security Policies
- **Pod Security Policies** : (기본값) **eks.privileged** 정보 확인
9. Extensions : *Custom Resource Definitions*, *Mutating Webhook Configurations*, and *Validating Webhook Configurations*
- CRD 및 Webhook 확인
2. Logging in EKS
- 로깅 종류 : control plane logging / node logging / application logging
[control plane logging] : 로그 이름 ( /aws/eks/<cluster-name>/cluster )
- EKS에서 활성화할 수 있는 모든 로그를 Cloudwatch에서 볼 수 있도록 로깅 활성화
# 모든 로깅 활성화
aws eks update-cluster-config --region ap-northeast-2 --name $CLUSTER_NAME \
    --logging '{"clusterLogging":[{"types":["api","audit","authenticator","controllerManager","scheduler"],"enabled":true}]}'

# 로그 그룹 확인
aws logs describe-log-groups | jq

# 로그 tail 확인 : aws logs tail help
aws logs tail /aws/eks/$CLUSTER_NAME/cluster | more

# 신규 로그를 바로 출력
aws logs tail /aws/eks/$CLUSTER_NAME/cluster --follow

# 필터 패턴
aws logs tail /aws/eks/$CLUSTER_NAME/cluster --filter-pattern <필터 패턴>

# 로그 스트림이름
aws logs tail /aws/eks/$CLUSTER_NAME/cluster --log-stream-name-prefix <로그 스트림 prefix> --follow
aws logs tail /aws/eks/$CLUSTER_NAME/cluster --log-stream-name-prefix kube-apiserver --follow
aws logs tail /aws/eks/$CLUSTER_NAME/cluster --log-stream-name-prefix kube-apiserver-audit --follow
aws logs tail /aws/eks/$CLUSTER_NAME/cluster --log-stream-name-prefix kube-scheduler --follow
aws logs tail /aws/eks/$CLUSTER_NAME/cluster --log-stream-name-prefix authenticator --follow
aws logs tail /aws/eks/$CLUSTER_NAME/cluster --log-stream-name-prefix kube-controller-manager --follow
aws logs tail /aws/eks/$CLUSTER_NAME/cluster --log-stream-name-prefix cloud-controller-manager --follow
kubectl scale deployment -n kube-system coredns --replicas=1
kubectl scale deployment -n kube-system coredns --replicas=2

# 시간 지정: 1초(s) 1분(m) 1시간(h) 하루(d) 한주(w)
aws logs tail /aws/eks/$CLUSTER_NAME/cluster --since 1h30m

# 짧게 출력
aws logs tail /aws/eks/$CLUSTER_NAME/cluster --since 1h30m --format short

- 로그 끄기
# EKS Control Plane 로깅(CloudWatch Logs) 비활성화
eksctl utils update-cluster-logging --cluster $CLUSTER_NAME --region ap-northeast-2 --disable-types all --approve

# 로그 그룹 삭제
aws logs delete-log-group --log-group-name /aws/eks/$CLUSTER_NAME/cluster
[컨테이너 (Pod) 로깅]
- nginx 웹서버 배포하기 (with ingress ALB)
# NGINX 웹서버 배포
helm repo add bitnami https://charts.bitnami.com/bitnami
helm repo update

# 도메인, 인증서 확인
echo $MyDomain $CERT_ARN

# 파라미터 파일 생성
cat <<EOT > nginx-values.yaml
service:
  type: NodePort

networkPolicy:
  enabled: false

resourcesPreset: "nano"

ingress:
  enabled: true
  ingressClassName: alb
  hostname: nginx.$MyDomain
  pathType: Prefix
  path: /
  annotations:
    alb.ingress.kubernetes.io/certificate-arn: $CERT_ARN
    alb.ingress.kubernetes.io/group.name: study
    alb.ingress.kubernetes.io/listen-ports: '[{"HTTPS":443}, {"HTTP":80}]'
    alb.ingress.kubernetes.io/load-balancer-name: $CLUSTER_NAME-ingress-alb
    alb.ingress.kubernetes.io/scheme: internet-facing
    alb.ingress.kubernetes.io/ssl-redirect: "443"
    alb.ingress.kubernetes.io/success-codes: 200-399
    alb.ingress.kubernetes.io/target-type: ip
EOT
cat nginx-values.yaml

# 배포
helm install nginx bitnami/nginx --version 19.0.0 -f nginx-values.yaml
# 확인
kubectl get ingress,deploy,svc,ep nginx
kubectl describe deploy nginx # Resource - Limits/Requests 확인
kubectl get targetgroupbindings # ALB TG 확인

# 접속 주소 확인 및 접속
echo -e "Nginx WebServer URL = https://nginx.$MyDomain"
curl -s https://nginx.$MyDomain
kubectl stern deploy/nginx
혹은
kubectl logs deploy/nginx -f

# 반복 접속
while true; do curl -s https://nginx.$MyDomain | grep title; date; sleep 1; done
while true; do curl -s https://nginx.$MyDomain -I | head -n 1; date; sleep 1; done
nginx 웹사이트 접근 확인

* 컨테이너 로그 환경의 로그는 표준 출력 (stdout)과 표준 에러 (stderr)로 보내는 것을 권고
작성된 컨테이너 애플리케이션의 로그는 해당 파드 안으로 접속하지 않아도 사용자는 외부에서 kubectl logs 명령어로 애플리케이션 종류에 상관없이, 애플리케이션마다 로그 파일 위치에 상관없이, 단일 명령어로 조회가 가능하다.
다만, 종료된 파드의 로그는 kubectl logs로 조회할 수 없다.
# 로그 모니터링
kubectl stern deploy/nginx
혹은
kubectl logs deploy/nginx -f

# nginx 웹 접속 시도

# 컨테이너 로그 파일 위치 확인
kubectl exec -it deploy/nginx -- ls -l /opt/bitnami/nginx/logs/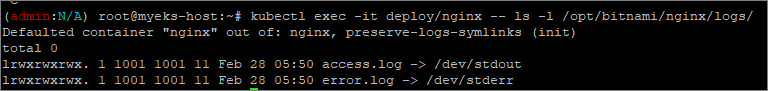
kubelet 기본 설정은 로그 파일의 최대 크기가 10Mi로 10Mi를 초과하는 로그는 전체 로그 조회가 불가능하다.
3. Container Insights metrics in Amazon Cloudwatch & Fluent Bit (Logs)
[CCI (CloudWatch Container Observability)]
노드에 CW Agent Pod와 Fluent Bit Pod가 데몬셋으로 배치되어 Metrics와 Logs 수집
- 컨테이너 및 클러스터 모니터링
- 클러스터, 노드, 네임스페이스, 파드, 컨테이너 수준의 메트릭(metrics) 및 로그(logs) 를 자동으로 수집
- CPU, 메모리, 디스크 I/O, 네트워크 트래픽 등 주요 성능 지표 모니터링
- Kubernetes의 오토스케일링(HPA)과 연계 가능
- 자동화된 데이터 수집
- AWS에서 제공하는 CloudWatch Agent를 사용하여 컨테이너 및 애플리케이션 로그/메트릭을 자동으로 수집
- AWS Container Insights 대시보드에서 실시간 성능 모니터링 가능
- 문제 탐지 및 경고 (Alert)
- CloudWatch Alarms를 사용하여 임계값 초과 시 자동 경고 생성
- AWS Lambda, SNS, Auto Scaling 등과 연계하여 문제 발생 시 자동 대응 가능
- 로그 분석 (AWS Logs insights 통합)
- CloudWatch Logs Insights와 통합하여 Kubernetes 로그 및 애플리케이션 로그를 쿼리 기반으로 분석
- 특정 컨테이너에서 발생한 오류 탐색 가능
- 서비스 맵 & 추적 (X-Ray 연계)
- AWS X-Ray와 통합하여 애플리케이션 트랜잭션 추적 및 서비스 맵 제공
- 마이크로서비스 간 지연 시간 분석 및 성능 최적화 가능
* Fluent Bit
경량 로그 및 메트릭 수집, 처리, 전달을 위한 오픈소스 데이터 수집기

- 수집 : Fluent Bit 컨테이너를 데몬셋으로 동작시키고 아래 3가지 종류의 로그를 Cloudwatch Logs로 전송
- 각 컨테이너/파드 로그
- /aws/containerinsights/[Cluster_Name]/application : 로그 소스 (All log files in `/var/log/containers`)
- 노드(호스트) 로그
- /aws/containerinsights/[Cluster_Name]/host : 로그 소스 (Logs from `/var/log/dmesg`, `/var/log/secure`, and `/var/log/messages`)
- 쿠버네티스 데이터플레인 로그
- /aws/containerinsights/[Cluster_Name]/dataplane : 로그 소스 (`/var/log/journal` for `kubelet.service`, `kubeproxy.service`, and `docker.service`)
- 각 컨테이너/파드 로그
- 저장 : Cloudwatch Logs에 로그를 저장, 로그 그룹 별 로그 보존 기간 설정 가능
- 시각화 : Cloudwatch의 Log insights를 사용해 대상 로그를 분석하고 Cloudwatch의 대시보드로 시각화한다.
4. Mertics-server & Kwatch
[Metrics-server]
kubelet으로부터 수집한 리소스 메트릭을 수집 및 집계하는 클러스터 애드온 구성 요소
- cAdvisor : kubelet에 포함된 컨테이너 메트릭을 수집, 집계, 노출하는 데몬

# 메트릭 서버 확인 : 메트릭은 15초 간격으로 cAdvisor를 통하여 가져옴
kubectl get pod -n kube-system -l app.kubernetes.io/name=metrics-server
kubectl api-resources | grep metrics
kubectl get apiservices |egrep '(AVAILABLE|metrics)'
# 노드 메트릭 확인
kubectl top node

# 파드 메트릭 확인
kubectl top pod -A
kubectl top pod -n kube-system --sort-by='cpu'
kubectl top pod -n kube-system --sort-by='memory
[Kwatch]
Kubernetes 클러스터에서 발생하는 이벤트를 실시간으로 모니터링할 수 있는 경량 Kubernetes 모니터링 도구
CloudWatch Container Insights와 같은 AWS 네이티브 솔루션이 아니라, 오픈소스 기반의 Kubernetes 네임스페이스 및 리소스 이벤트 스트리밍 도구
# 닉네임
NICK=<각자 자신의 닉네임>
NICK=gasida

# configmap 생성
cat <<EOF | kubectl apply -f -
apiVersion: v1
kind: Namespace
metadata:
  name: kwatch
---
apiVersion: v1
kind: ConfigMap
metadata:
  name: kwatch
  namespace: kwatch
data:
  config.yaml: |
    alert:
      slack:
        webhook: 'https://hooks.slack.com/services/***********************
        title: $NICK-eks
    pvcMonitor:
      enabled: true
      interval: 5
      threshold: 70
EOF

# 배포
kubectl apply -f https://raw.githubusercontent.com/abahmed/kwatch/v0.8.5/deploy/deploy.yaml
5. 프로메테우스 - 스택
프로메테우스 스택은 k8s 환경에서 모니터링 및 알림 시스템을 구축하기 위한 오픈소스 스택이다.
프로메테우스를 중심으로 여러 관려 도구 (grafana, alertmanager, node exporter ...등)가 결합되어 있으며 주로 k8s 및 클라우드 네이티브 애플리케이션 모니터링에 사용된다.

[설치]
모니터링에 필요한 여러 요소를 단일 차트(스택)으로 제공 < 시각화 (그라파나) + 이벤트 메시지 정책 (경고 임계값/수준) 등
# 모니터링
watch kubectl get pod,pvc,svc,ingress -n monitoring

# repo 추가
helm repo add prometheus-community https://prometheus-community.github.io/helm-charts

# 파라미터 파일 생성
cat <<EOT > monitor-values.yaml
prometheus:
  prometheusSpec:
    scrapeInterval: "15s"
    evaluationInterval: "15s"
    podMonitorSelectorNilUsesHelmValues: false
    serviceMonitorSelectorNilUsesHelmValues: false
    retention: 5d
    retentionSize: "10GiB"
    storageSpec:
      volumeClaimTemplate:
        spec:
          storageClassName: gp3
          accessModes: ["ReadWriteOnce"]
          resources:
            requests:
              storage: 30Gi

  ingress:
    enabled: true
    ingressClassName: alb
    hosts:
      - prometheus.$MyDomain
    paths:
      - /*
    annotations:
      alb.ingress.kubernetes.io/scheme: internet-facing
      alb.ingress.kubernetes.io/target-type: ip
      alb.ingress.kubernetes.io/listen-ports: '[{"HTTPS":443}, {"HTTP":80}]'
      alb.ingress.kubernetes.io/certificate-arn: $CERT_ARN
      alb.ingress.kubernetes.io/success-codes: 200-399
      alb.ingress.kubernetes.io/load-balancer-name: myeks-ingress-alb
      alb.ingress.kubernetes.io/group.name: study
      alb.ingress.kubernetes.io/ssl-redirect: '443'

grafana:
  defaultDashboardsTimezone: Asia/Seoul
  adminPassword: prom-operator

  ingress:
    enabled: true
    ingressClassName: alb
    hosts:
      - grafana.$MyDomain
    paths:
      - /*
    annotations:
      alb.ingress.kubernetes.io/scheme: internet-facing
      alb.ingress.kubernetes.io/target-type: ip
      alb.ingress.kubernetes.io/listen-ports: '[{"HTTPS":443}, {"HTTP":80}]'
      alb.ingress.kubernetes.io/certificate-arn: $CERT_ARN
      alb.ingress.kubernetes.io/success-codes: 200-399
      alb.ingress.kubernetes.io/load-balancer-name: myeks-ingress-alb
      alb.ingress.kubernetes.io/group.name: study
      alb.ingress.kubernetes.io/ssl-redirect: '443'

  persistence:
    enabled: true
    type: sts
    storageClassName: "gp3"
    accessModes:
      - ReadWriteOnce
    size: 20Gi

alertmanager:
  enabled: false
defaultRules:
  create: false
kubeControllerManager:
  enabled: false
kubeEtcd:
  enabled: false
kubeScheduler:
  enabled: false
prometheus-windows-exporter:
  prometheus:
    monitor:
      enabled: false
EOT
cat monitor-values.yaml

# 배포
helm install kube-prometheus-stack prometheus-community/kube-prometheus-stack --version 69.3.1 \
-f monitor-values.yaml --create-namespace --namespace monitoring
# 확인
## alertmanager-0 : 사전에 정의한 정책 기반(예: 노드 다운, 파드 Pending 등)으로 시스템 경고 메시지를 생성 후 경보 채널(슬랙 등)로 전송
## grafana-0 : 프로메테우스는 메트릭 정보를 저장하는 용도로 사용하며, 그라파나로 시각화 처리
## prometheus-0 : 모니터링 대상이 되는 파드는 ‘exporter’라는 별도의 사이드카 형식의 파드에서 모니터링 메트릭을 노출, pull 방식으로 가져와 내부의 시계열 데이터베이스에 저장
## node-exporter : 노드익스포터는 물리 노드에 대한 자원 사용량(네트워크, 스토리지 등 전체) 정보를 메트릭 형태로 변경하여 노출
## operator : 시스템 경고 메시지 정책(prometheus rule), 애플리케이션 모니터링 대상 추가 등의 작업을 편리하게 할수 있게 CRD 지원
## kube-state-metrics : 쿠버네티스의 클러스터의 상태(kube-state)를 메트릭으로 변환하는 파드
helm list -n monitoring
kubectl get sts,ds,deploy,pod,svc,ep,ingress,pvc,pv -n monitoring
kubectl get-all -n monitoring
kubectl get prometheus,servicemonitors -n monitoring
kubectl get crd | grep monitoring
kubectl df-pv

# 프로메테우스 버전 확인
echo -e "https://prometheus.$MyDomain/api/v1/status/buildinfo"
open https://prometheus.$MyDomain/api/v1/status/buildinfo # macOS
kubectl exec -it sts/prometheus-kube-prometheus-stack-prometheus -n monitoring -c prometheus -- prometheus --version
prometheus, version 3.1.0 (branch: HEAD, revision: 7086161a93b262aa0949dbf2aba15a5a7b13e0a3)
...

# 프로메테우스 웹 접속
echo -e "https://prometheus.$MyDomain"
open "https://prometheus.$MyDomain" # macOS

# 그라파나 웹 접속
echo -e "https://grafana.$MyDomain"
open "https://grafana.$MyDomain" # macOS

- AWS CNI Metrics 수집을 위한 사전 설정
# PodMonitor 배포
cat <<EOF | kubectl create -f -
apiVersion: monitoring.coreos.com/v1
kind: PodMonitor
metadata:
  name: aws-cni-metrics
  namespace: kube-system
spec:
  jobLabel: k8s-app
  namespaceSelector:
    matchNames:
    - kube-system
  podMetricsEndpoints:
  - interval: 30s
    path: /metrics
    port: metrics
  selector:
    matchLabels:
      k8s-app: aws-node
EOF

# PodMonitor 확인
kubectl get podmonitor -n kube-system
kubectl get podmonitor -n kube-system aws-cni-metrics -o yaml | kubectl neat
...
* 프로메테우스 기본 사용 (모니터링 그래프)
- 모니터링 대상이 되는 서비스는 일반적으로 자체 웹 서버의 /metrics 엔드포인트 경로에 다양한 메트릭 정보를 노출
- 이후 프로메테우스는 해당 경로에 http get 방식으로 메트릭 정보를 가져와 TSDB 형식으로 저장
# 아래 처럼 프로메테우스가 각 서비스의 포트 접속하여 메트릭 정보를 수집
kubectl get node -owide
kubectl get svc,ep -n monitoring kube-prometheus-stack-prometheus-node-exporter

# (노드 익스포터 경우) 노드의 9100번 포트의 /metrics 접속 시 다양한 메트릭 정보를 확인할수 있음 : 마스터 이외에 워커노드도 확인 가능
ssh ec2-user@$N1 curl -s localhost:9100/metrics
- 프로메테우스 웹 접속

- Query : 프로메테우스 자체 검색 언어 PromQL을 이용하여 메트릭 정보를 조회 > 단순한 그래프 형태
- 쿼리 입력 옵션
- Use local time : 출력 시간을 로컬 타임으로 변경
- Enable query history : PromQL 쿼리 히스토리 활성화
- Enable autocomplete : 자동 완성 기능 활성화
- Enable highlighting : 하이라이팅 기능 활성화
- Enable linter : 문법 오류 감지, 자동 코스 스타일 체크
- 쿼리 입력 옵션
- Alerts : 사전에 정의한 시스템 경고 정책(Prometheus Rules)에 대한 상황
- Status : 경고 메시지 정책(Rules), 모니터링 대상 (Targets) 등 다양한 프로메테우스 설정 내역을 확인 > 버전 정보
[PromQL]
- 프로메테우스 메트릭 종류 (4가지)
- Gauge 게이지 : 특정 시점의 값을 표현하기 위해 사용하는 메트릭 타입, CPU 온도나 메모리 사용량에 대한 현재 시점 값
- Counter 카운터 : 누적된 값을 표현하기 위해 사용하는 메트릭 타입, 증가 시 구간 별로 변화 확인, 계속 증가 > 함수 등으로 활용
- Summary 서머리 : 구간 내에 있는 메트릭 값의 빈도, 중앙값 등 통계적 메트릭
- Histogram 히스토그램 : 사전에 미리 정의한 구간 내에 있는 메트릭 값의 빈도를 측정 > 함수로 측정 포맷을 변경
- 프로메테우스 쿼리
- 정규표현식
# 예시
node_memory_Active_bytes
node_memory_Active_bytes{instance="192.168.1.188:9100"}
node_memory_Active_bytes{instance!="192.168.1.188:9100"}

# 정규표현식
node_memory_Active_bytes{instance=~"192.168.+"}
node_memory_Active_bytes{instance=~"192.168.1.+"}

# 다수 대상
node_memory_Active_bytes{instance=~"192.168.1.188:9100|192.168.2.170:9100"}
node_memory_Active_bytes{instance!~"192.168.1.188:9100|192.168.2.170:9100"}

# 여러 조건 AND
kube_deployment_status_replicas_available{namespace="kube-system"}
kube_deployment_status_replicas_available{namespace="kube-system", deployment="coredns"}
- 이진연산자
# 산술 이진 연산자 : + - * / * ^
node_memory_Active_bytes
node_memory_Active_bytes/1024
node_memory_Active_bytes/1024/1024

# 비교 이진 연산자 : = =  ! = > < > = < =
nginx_http_requests_total
nginx_http_requests_total > 100
nginx_http_requests_total > 10000

# 논리/집합 이진 연산자 : and 교집합 , or 합집합 , unless 차집합
kube_pod_status_ready
kube_pod_container_resource_requests

kube_pod_status_ready == 1
kube_pod_container_resource_requests > 1

kube_pod_status_ready == 1 or kube_pod_container_resource_requests > 1
kube_pod_status_ready == 1 and kube_pod_container_resource_requests > 1
- 집계 연산자
#
node_memory_Active_bytes

# 출력 값 중 Top 3
topk(3, node_memory_Active_bytes)

# 출력 값 중 하위 3
bottomk(3, node_memory_Active_bytes)
bottomk(3, node_memory_Active_bytes>0)

# node 그룹별: by
node_cpu_seconds_total
node_cpu_seconds_total{mode="user"}
node_cpu_seconds_total{mode="system"}

avg(node_cpu_seconds_total)
avg(node_cpu_seconds_total) by (instance)
avg(node_cpu_seconds_total{mode="user"}) by (instance)
avg(node_cpu_seconds_total{mode="system"}) by (instance)

#
nginx_http_requests_total
sum(nginx_http_requests_total)
sum(nginx_http_requests_total) by (instance)

# 특정 내용 제외하고 출력 : without
nginx_http_requests_total
sum(nginx_http_requests_total) without (instance)
sum(nginx_http_requests_total) without (instance,container,endpoint,job,namespace)
6. Grafana
TSDB 데이터를 시각화, 다양한 데이터 형식 지원 (메트릭, 로그, 트레이스 등)
그라파나는 시각화 솔루션으로 데이터를 저장하지 않음 > 현재 실습 환경에서는 데이터 소스는 프로메테우스를 사용
# 그라파나 버전 확인
kubectl exec -it -n monitoring sts/kube-prometheus-stack-grafana -- grafana cli --version
grafana cli version 11.5.1

# ingress 확인
kubectl get ingress -n monitoring kube-prometheus-stack-grafana
kubectl describe ingress -n monitoring kube-prometheus-stack-grafana

# ingress 도메인으로 웹 접속 : 기본 계정 - admin / prom-operator
echo -e "Grafana Web URL = https://grafana.$MyDomain"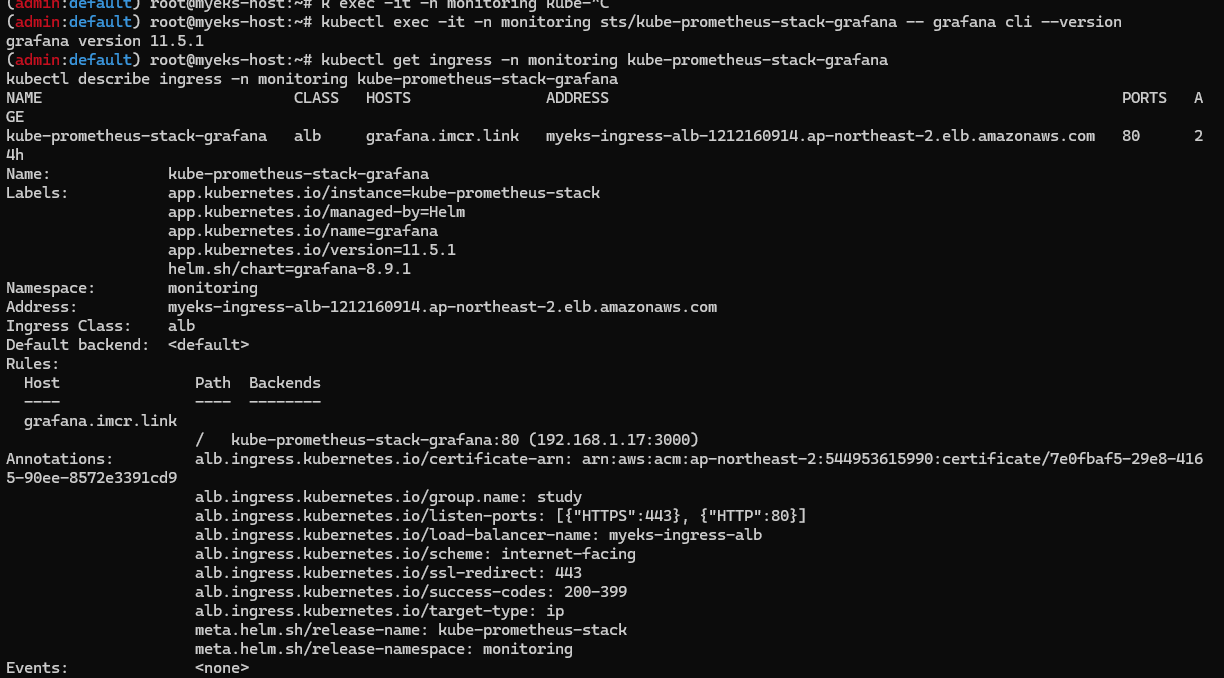
웹 접속 후 Connections에서 프로메테우스 url 연결 가능 (스택이면 이미 연결되어 있음)
# 서비스 주소 확인
kubectl get svc,ep -n monitoring kube-prometheus-stack-prometheus
# 테스트용 파드 배포
cat <<EOF | kubectl create -f -
apiVersion: v1
kind: Pod
metadata:
  name: netshoot-pod
spec:
  containers:
  - name: netshoot-pod
    image: nicolaka/netshoot
    command: ["tail"]
    args: ["-f", "/dev/null"]
  terminationGracePeriodSeconds: 0
EOF
kubectl get pod netshoot-pod

# 접속 확인
kubectl exec -it netshoot-pod -- nslookup kube-prometheus-stack-prometheus.monitoring
kubectl exec -it netshoot-pod -- curl -s kube-prometheus-stack-prometheus.monitoring:9090/graph -v ; echo

# 삭제
kubectl delete pod netshoot-pod
* 공식 대시보드 가져오기
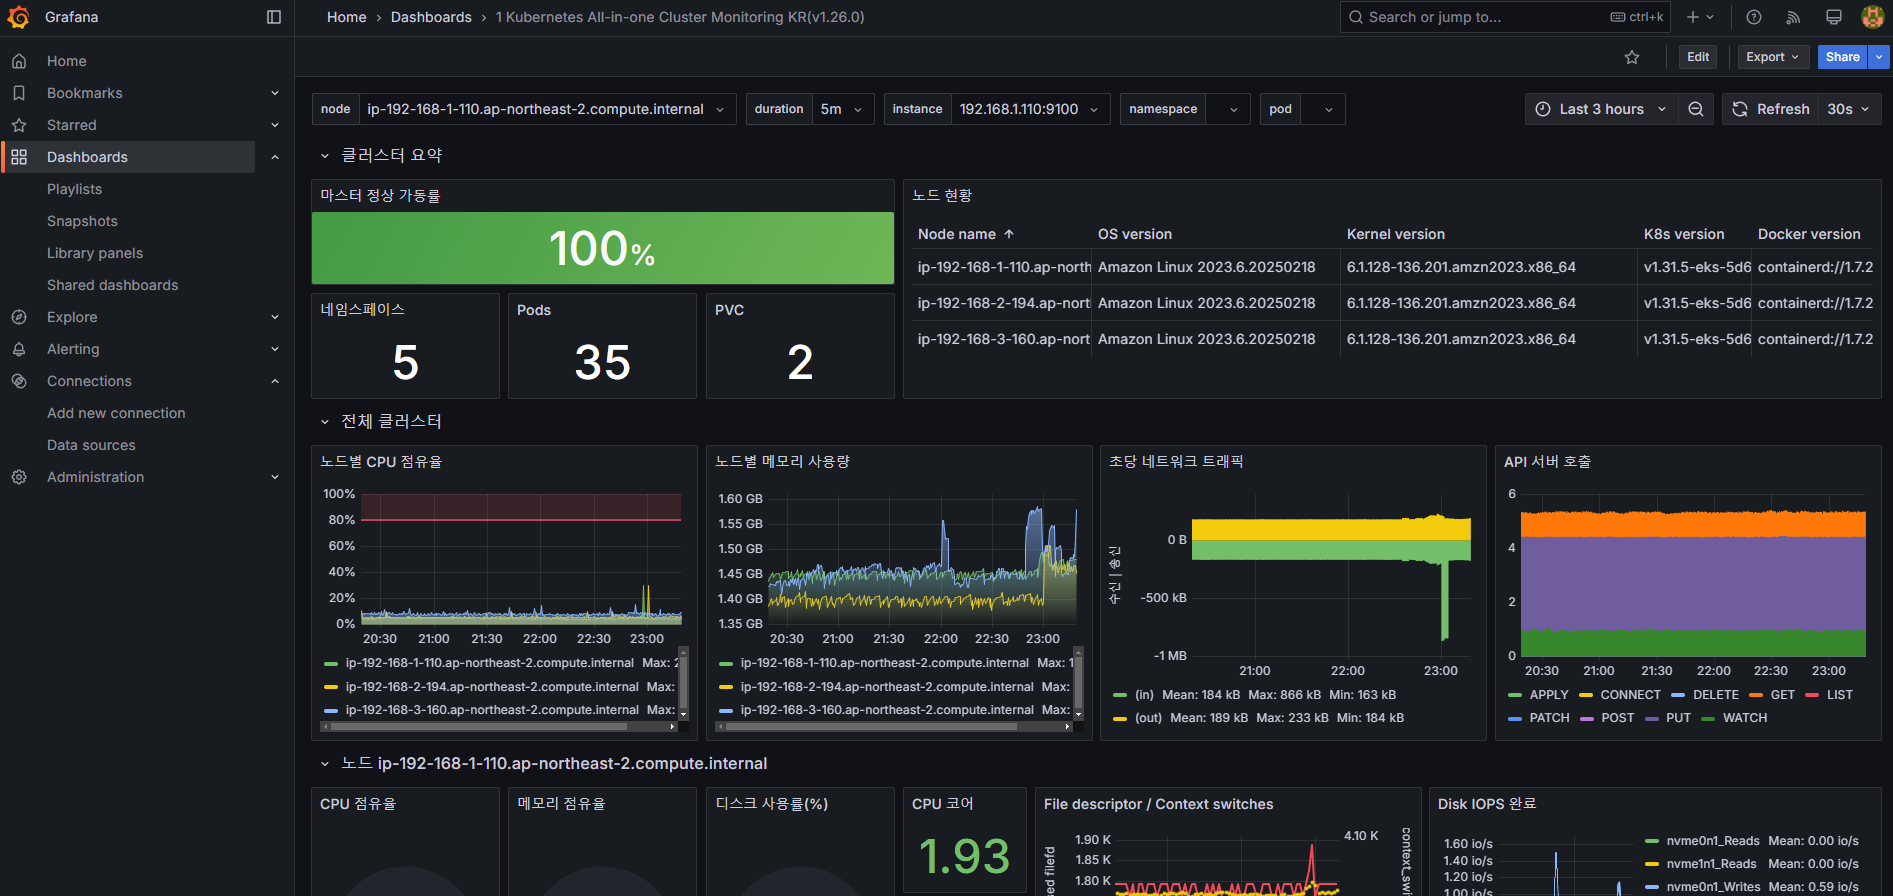
1) Dashboard > NEW > Import > ID 15757 (Kubernetes / view / Global ) 입력 > Load > 데이터 소스 Prometheus 선택 > Import

2) Dashboard > NEW > Import > ID 17900 ( 1 kubernetes All-in-one cluster monitoring KR) 입력 > Load > 데이터 소스 Prometheus 선택 > Import
* 대시보드 커스텀
sum by (node) (irate(node_cpu_seconds_total{mode!~"guest.*|idle|iowait", node="$node"}[5m]))

node_cpu_seconds_total
node_cpu_seconds_total{mode!~"guest.*|idle|iowait"}
avg(node_cpu_seconds_total{mode!~"guest.*|idle|iowait"}) by (node)
avg(node_cpu_seconds_total{mode!~"guest.*|idle|iowait"}) by (instance)

# 수정
sum by (instance) (irate(node_cpu_seconds_total{mode!~"guest.*|idle|iowait", instance="$instance"}[5m]))

# 수정 : 메모리 점유율
(node_memory_MemTotal_bytes{instance="$instance"}-node_memory_MemAvailable_bytes{instance="$instance"})/node_memory_MemTotal_bytes{instance="$instance"}

# 수정 : 디스크 사용률
sum(node_filesystem_size_bytes{instance="$instance"} - node_filesystem_avail_bytes{instance="$instance"}) by (instance) / sum(node_filesystem_size_bytes{instance="$instance"}) by (instance)
'Cloud > Kubernetes' 카테고리의 다른 글
| [AEWS3기] 3주차 EKS Storage, Managed Node Groups (0) | 2025.02.19 |
|---|---|
| [AEWS3기] 2주차 - EKS Networking (2) (0) | 2025.02.14 |
| [AEWS3기] 2주차 - EKS Networking (1) (0) | 2025.02.13 |
| [AEWS3기] 1주차 - Amazon EKS 설치 및 기본 사용 (4) (0) | 2025.02.08 |
| [AEWS3기] 1주차 - Amazon EKS 설치 및 기본 사용 (3) (0) | 2025.02.05 |


